
|
Use of Skin-Shock at the Judge Rotenberg Educational Center (JRC) |
TREATMENT OF AGGRESSION WITH BEHAVIORAL PROGRAMMING THAT INCLUDES SUPPLEMENTARY SKIN-SHOCK
Matthew L. Israel, Nathan A. Blenkush, Robert E. von Heyn, and Patricia M. Rivera
Judge Rotenberg Educational Center
Canton, MA USA
Abstract
Behavioral treatment of
aggression with contingent skin shock (CSS) has been investigated in relatively
few studies and never with cognitively typical individuals. We evaluated CSS
during a 3-year period with 65 participants,
Key words: aggression,
contingent shock, skin-shock, punishment
Treatment of Aggression with
Behavioral Programming that Includes Supplemental Skin-Shock
Individuals who exhibit
high frequency and/or high intensity aggressive behaviors are often treated with
psychotropic medication and behavioral procedures. Unfortunately, psychotropic
drugs have proven ineffective in treating th
The behavioral procedures
employed in current clinical practice to treat aggression are usually limited to
“positive-only” procedures such as the manipulation of positive reinforcers, th
Contingent skin-shock
(CSS), when used as a supplement to other behavioral procedures, has proven
effective in treating various problem behaviors that were otherwise intractable.
Most of the CSS treatment studies that have been published since 1965 have
involved self-injurious behaviors (e.g., Salvy, Mulick, Butter,
With respect to the use of
CSS to treat aggression, we found nine original published studies but none in
the last 13 years. The topographies treated included aggressive biting (Foxx,
Zukotynski, & Williams, 1994), hair-pulling and aggressive/destructive episodes
(Foxx, Bittle, & Faw, 1989), pinching, kicking, hitting, and hair-pulling (Foxx,
McMorrow, Bittle & Bechtel, 1986), assaults toward others (Ball, Sibbach, Jones,
Steele, & Frazier, 1975), biting, kicking, and choking (Brandsma & Stein, 1973),
physically striking another person, (Browning, 1971), hitting, kicking, biting,
spitting, and verbal threats to aggress (Ludwig, Marx, Hill, & Browning, 1969),
biting, (Birnbrauer, 1968) and aggression toward a brother (Risley 1968).
The CSS literature has
limitations. First, most papers report CSS use with only one or relatively few
individuals. The largest study was by
Second, a variety of shock
delivery systems with varying shock intensity and durations have been used. For
example, within the past 21 years, shock delivery systems have included the HSP
3012 (
Third, most CSS studies
have been with participants who functioned at a relatively low cognitive level
and who had diagnoses such as severe mental retardation (MR) and related
disabilities. Few studies have involved participants with normal or near-normal
cognitive levels who had diagnoses such as conduct disorder, bipolar disorder,
oppositional defiant disorder, and impulse control disorder.
In this paper we report
data and procedures that address these issues. We treated aggression in 65
individuals with widely differing levels of cognitive functioning for periods of
up to three years, using positive behavioral procedures supplemented with CSS.
We report the immediate effects of CSS insertion on behavior frequency, the
overall reductive effect of CSS, and its effect on ongoing accelerations or
decelerations. We compare the reductive effect of CSS with the reductive effect
of Positive Behavior Support in treating aggression. We describe the
differential effect of CSS treatment on participants with differing levels of
cognitive functioning. And we describe the effect of CSS treatment of aggression
on the need for psychotropic medication, on the need for emergency takedown
restraint, and on aggression-caused staff injuries.
Method
Participants
A total of 65 (44 mal
Demographic information for the participants is presented in Table 1. Note that
the total of Other Diagnoses (89) exceeds the number of participants (65)
because many participants had multiple diagnoses. Forty six percent did not hav
Table 1
Participant demographic information including frequency count of all assigned
diagnoses (N=65)
|
|
Number |
% |
|
Gender |
|
|
|
male
|
44 |
68 |
|
female |
21 |
32 |
|
Total |
65 |
100 |
|
|
|
|
|
Age |
|
|
|
<10 |
1 |
1.5 |
|
10-15 |
15 |
23.1 |
|
16-20 |
42 |
64.6 |
|
21-25 |
5 |
7.7 |
|
26< |
2 |
3.1 |
|
Total |
65 |
100 |
|
|
|
|
|
Diagnosis re Mental
Retardation Status |
|
|
|
No
Mental Retardation |
30 |
46.2 |
|
Mild |
11 |
16.9 |
|
Moderate |
9 |
13.9 |
|
Severe/Profound |
15 |
23.0 |
|
Total |
65 |
100 |
|
|
|
|
|
Other Diagnoses |
|
|
|
Autism |
17 |
|
|
Mood Disorder NOS |
12 |
|
|
Intermittent Explosive Disorder |
11 |
|
|
Conduct Disorder |
9 |
|
|
Oppositional Defiant Disorder |
9 |
|
|
Bipolar Disorder |
8 |
|
|
Pervasive Developmental Disorder |
6 |
|
|
Attention Deficit Hyperactive Disorder |
5 |
|
|
Impulse Control Disorder |
3 |
|
|
Disruptive Behavior Disorder |
2 |
|
|
Antisocial Personality Disorder |
1 |
|
|
Borderline Personality Disorder |
1 |
|
|
Depressive Disorder NOS |
1 |
|
|
Mental Disorder NOS |
1 |
|
|
Schizophrenia |
1 |
|
|
Sexual Disorder NOS |
1 |
|
|
Tourette's Disorder |
1 |
|
|
Total |
89 |
|
The participants wer
CSS was not considered for
each participant until a variety of positive-only procedures had been tried at
JRC and had been found or judged to be insufficiently effective in light of the
clinical needs of each participant. The median number of weeks during which
positive-only procedures alone were tried, prior to the introduction of CSS, was
37 (range 2-108). In a few cases, where th
Psychotropic medication
Fifty-two of the 65
participants were receiving a median of 2 (range 1-6) psychotropic medications
when they enrolled at JRC. Under the direction of a consulting psychiatrist,
these medications were gradually reduced over a median of 5 (range 0-42) months.
Most participants were weaned from psychotropic medication during the baseline
phase. In a few cases the weaning extended into the treatment phase.
Safeguards
The following safeguards
were in effect prior to the use of CSS. (a) The parent/guardian gave informed
written consent to the use of CSS. (b) If the participant was of school age, CSS
was placed in his or her Individual Education Plan. (c) A doctoral level
clinician, with training in behavioral psychology, headed the participant’s
treatment team and composed a treatment plan that included the option to employ
CSS. (d) A physician and, wher
Additional safeguards were
in effect after the treatment plan went into effect. Reports on the
participant’s treatment status were submitted to the Probate Court every 3
months and the judge held a formal review each year. In all cases in which CSS
was used for 3 or more years, a special committee composed of JRC staff and
consultants, including two independent clinicians unaffiliated with JRC,
reviewed the treatment and its results to determine if it should continue.
Setting
All participants lived in
apartments or homes operated and staffed by JRC and were transported to and from
JRC’s day program where they received treatment, education, and vocational
instruction and opportunities. During the first 4 months of the 3-year period
reported here, participants attended the day program 5 days per week. During the
remaining 32 months of the period, participants attended the day program 7 days
per week. The same treatment procedures were in plac
The participants’ programs
in both day and residential settings were monitored directly by on-scene
supervisors, as well as remotely by supervisors who watched liv
Behavior categories and
topographies
A supervising clinician,
with a caseload of 15 to 20, oversaw each participant’s program with th
Examples of topographies
within th
For all participants,
aggression was only one of several behavior categories that were treated with
CSS at the same time. The other categories that were treated depended on the
participant’s treatment plan and could include health dangerous
(self-injurious), destructive (e.g., breaking windows, desks, computers),
noncompliant (e.g., refusal to follow a request), and major disruptive (e.g.
swearing, yelling, disrobing in public, etc.), behaviors. Data for the treatment
of these other behavior categories are not included in this report.
Data collection
Frequency data was
collected by direct care staff 24 hours per day, 7 days per week. Each
aggressive topography was tallied as it occurred, using recording sheets that
were segmented by hour and that accompanied the participants in all activities.
Hand counters were used to count high frequency behaviors. Aggressive behavior
sometimes occurred in episodes in which several aggressiv
To evaluate the effects of
CSS treatment of aggression on participants of differing functioning levels we
classified students by functioning level and compared the reductive effect of
the treatment on the two groups. To obtain information about psychotropic
medication use, emergency takedown restraints, and aggression-caused staff
injuries we reviewed the participants’ records as well as records of staff
injuries.
Materials
CSS was administered by
means of a skin-shock device called the Graduated Electronic Decelerator (GED).
GEDs of two strengths were used—the GED-1 and GED-4. The GED-1 produced an
average current of 15 mA RMS and an average voltage of 60 V RMS when applied to
a resistor of 4 kΩ (typical skin resistance for the GED-1). The electrical
stimulus was a preset, 2 s train of direct current square waves with a duty
cycle of 25% and a pulse repetition frequency of 80 pulses per second. The GED-4
produced an average current of 41 mA RMS and an average voltage of 66 V RMS when
applied to a resistor of 1.6 kΩ (typical skin resistance for the GED-4). The
other parameters of the GED-4 were identical to those of the GED-1.
Each GED system was
comprised of a remote control transmitter, a shock generator (the GED device
itself), a battery and an electrode. The transmitter, a SECO-LARM (model
SK-919TD2A) two-channel RF transmitter, operated at 315 MHz and transmitted a
uniquely coded signal to the receiver which was worn by the participant. The
transmitter was housed in a lexan box (104 mm x 76 mm x 38mm) with the
participant’s nam
The shock generator
consisted of a receiver (SECO-LARM model SK-910) set to the same cod
A 12 V rechargeable nickel
metal hydride battery pack (Panasonic P/N HHR-AAB 2000 mAh) provided power to
the shock generator and was housed in a lexan box with the same dimensions as
those of the shock generator. The battery unit weighed 397 g. The battery
was attached by Velcro to the shock generator and connected to it electrically
by a short cable (Hirose Electric Co., Ltd., Part # H0063-ND). The battery and
shock generator were both carried in a back pack or fanny pack worn by the
participant. A cable (Hirose Electric Co., Ltd., Part # H0063-ND) connected the
shock generator to the electrode. Each electrode was attached to one of several
pre-approved locations, typically th
The electrodes employed
during the 3-year period were of two types: (1) a “concentric” electrode which
consisted of a stainless steel button (diameter 9.5 mm, thickness
3.25 mm) surrounded by a stainless steel ring (outer diameter 21.5 mm,
inner diameter 16.5 mm, thickness 3.25 mm) with 2.35 mm between the outer edge
of the button and the inner edge of the ring; or (2) a “distanced”
electrode consisted of two stainless steel buttons (diameter 9.5 mm, thickness
3.25mm) mounted up to 15.24 cm apart on flexible nonconductive material. During
the 3-year period covered in this report, the vast majority of the participants
wore distanced electrodes.
Each participant wore from
one to five GED sets (each consisting of battery, shock generator, and
associated electrode), depending on the decision of the participant’s clinician.
Each remote control unit sent a signal to only one particular GED shock
generator and that shock generator was connected to one electrode on the
participant’s body. When a participant wore more than one GED set, the therapist
possessed a separate remote control for each set. In these cases, on any given
application the participant did not know which electrode would deliver the
skin-shock (i.e., which remote control device the staff member would employ).
Procedure
There were two phases,
baseline followed by treatment.
Baseline (Positive
Programming). Upon admission,
functional assessments were completed for each participant. These suggested
functions that were varied among individuals and were sometimes multipl
To tak
The participant’s clinician
reviewed daily behavior frequencies and frequency trends over time. As the
clinicians prescribed and adjusted combinations of antecedent, reinforcement,
extinction, response cost, and other procedures, they wer
During the baseline phase,
a variety of positive programming procedures were employed to decrease th
Participants also received
points, tokens, and other reinforcers on an intermittent basis throughout the
day (essentially on an intermittent, momentary DRA schedule) provided they were
“on contract” and engaging in appropriate behavior at the time the reinforcer
was delivered.
Points, tokens, and direct
access to reinforcers could also be earned by learning new academic, self-car
Points and tokens could be
turned in for access to one or more of the following: money (participants could
earn as much as $30 per week); field trips; the Reward Corner of the classroom;
the Big Reward Store, which was an arcade-type room with pool table,
pinball machines, video games etc.; the internet; the Contract Store, which was
a retail “store” with a variety of items for sale; items in the Classroom Reward
Box; weekly field day activity, including barbecu
Other procedures included
functional communication training, training in social skills, self-instruction
in academic skills using personal computers as teaching machines (Skinner,
1958), and vocational training. Higher functioning participants were given
behavioral counseling, self-management training, a course in behavioral
psychology presenting a simplified version of the concepts presented in
Skinner’s “Scienc
Every item or activity that
the participants might enjoy was used as a contingent reward to encourage
desired behavior. Undesired behavior resulted in money or point fines and/or a
loss of privileges previously earned. Extremely dangerous behaviors were
contained using emergency restraint and protective equipment. In some cases,
mechanical restraint was employed to insure the participant’s safety.
Treatment (Add
Skin-Shock). In this phase, all of
the positive procedures employed during the baseline phase continued to be used
and adjusted by the clinicians; however, all topographies listed under th
Some participants wore more
than one GED, and up to a maximum of five GEDs, if it was necessary to consequat
In certain cases, when
equipment failure or other factors prevented th
During the treatment phase,
each time the student displayed an aggressive behavior, the staff member who
administered the GED recorded th
All 65 participants were
included in the Treatment phase. A total of 56 were started on skin-shock using
the GED-1, and 9 were started using the GED-4. The decision as to which to start
with was made by the clinician, and depended on factors such as the seriousness
and severity of the problem behavior, the participant’s previous history, and
the need to maximize the likelihood of rapid and effective treatment.
In two cases, the GED-1 was
employed first and the participant was later switched to the GED-4 either
because the GED-1 was judged to be insufficiently effective in treating th
Results
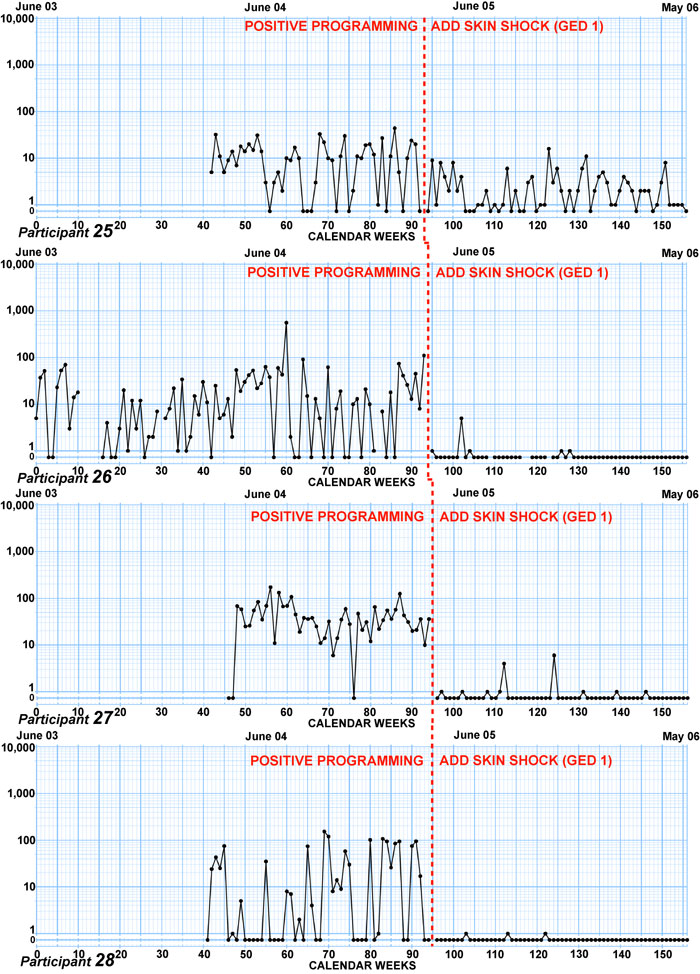
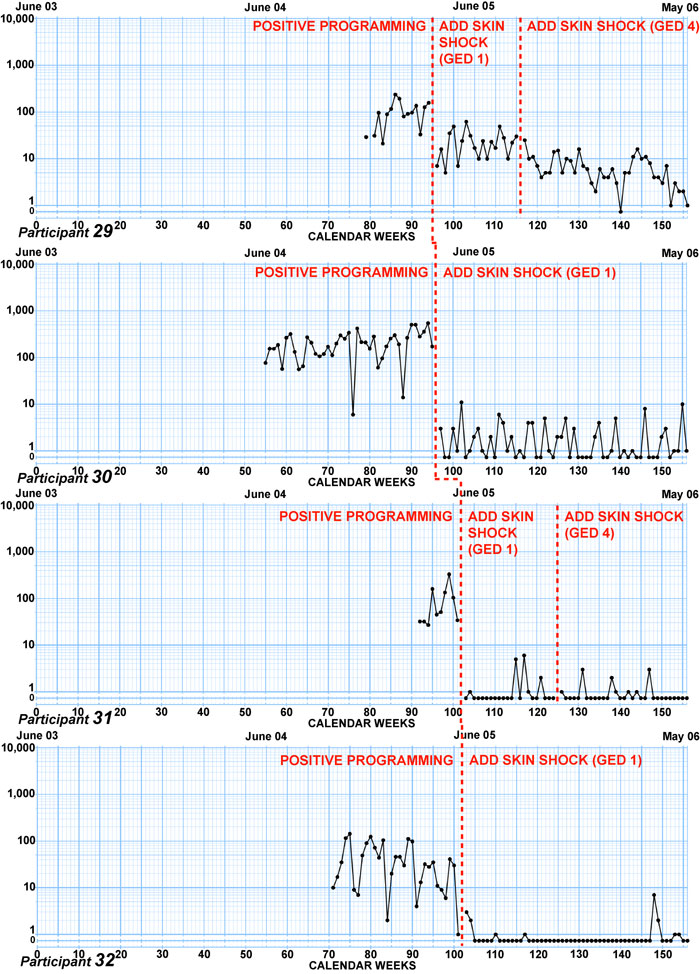
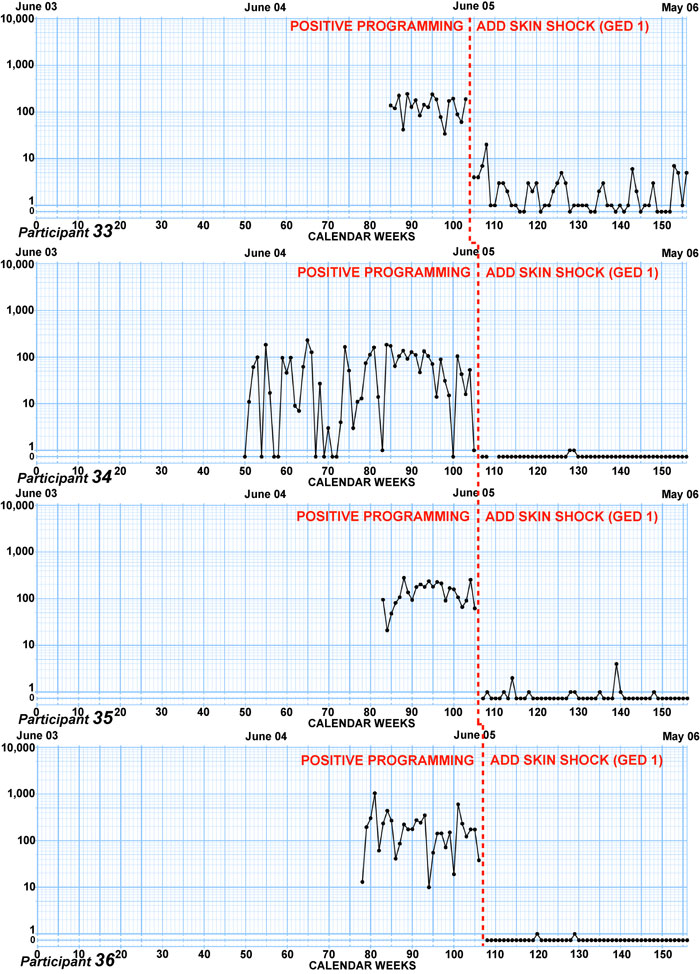
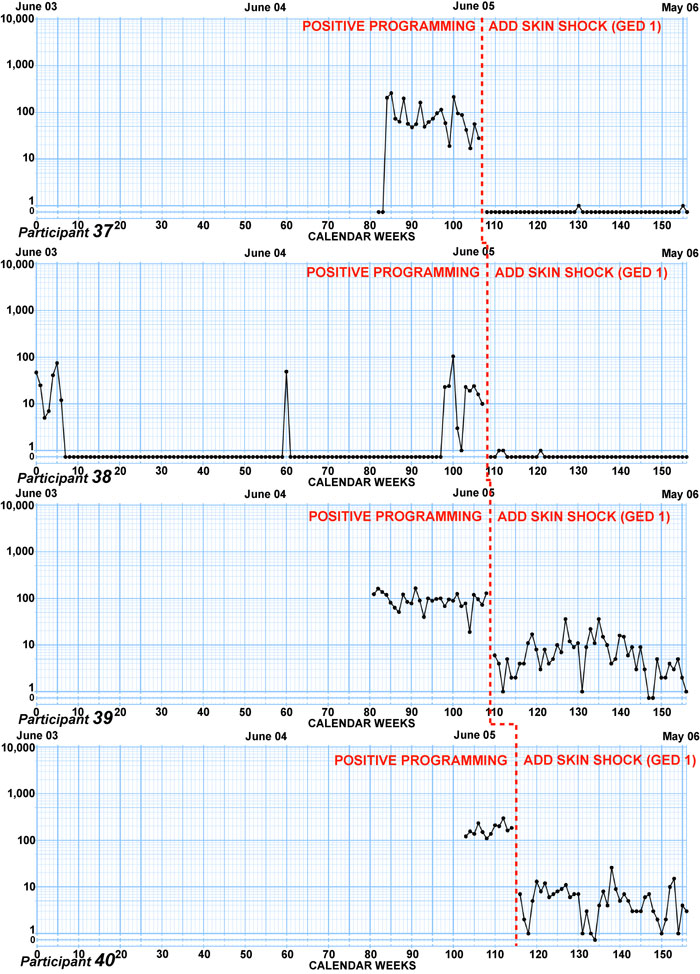
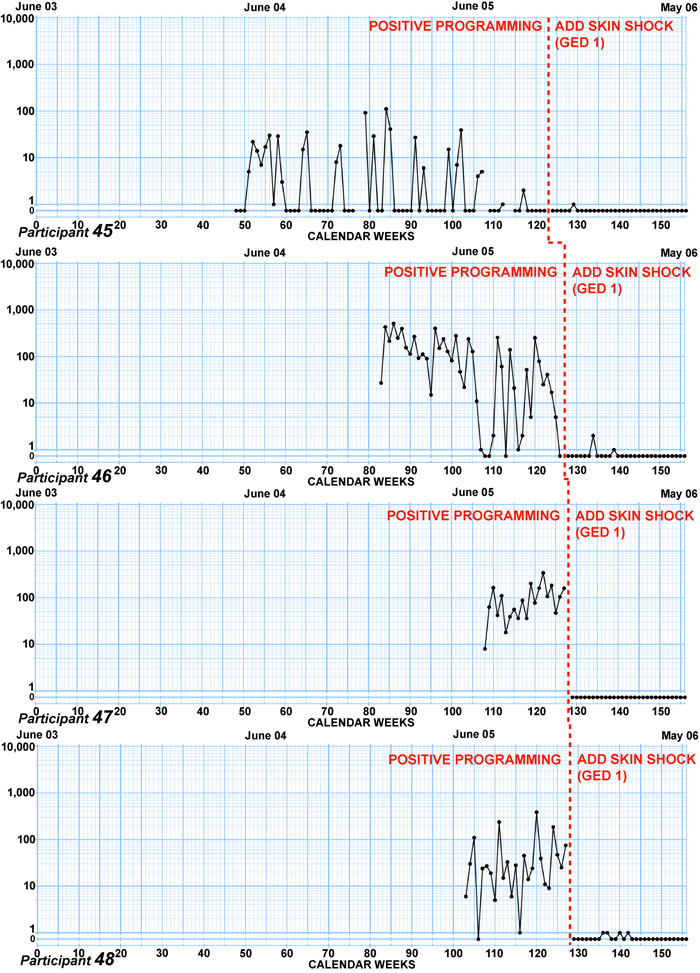
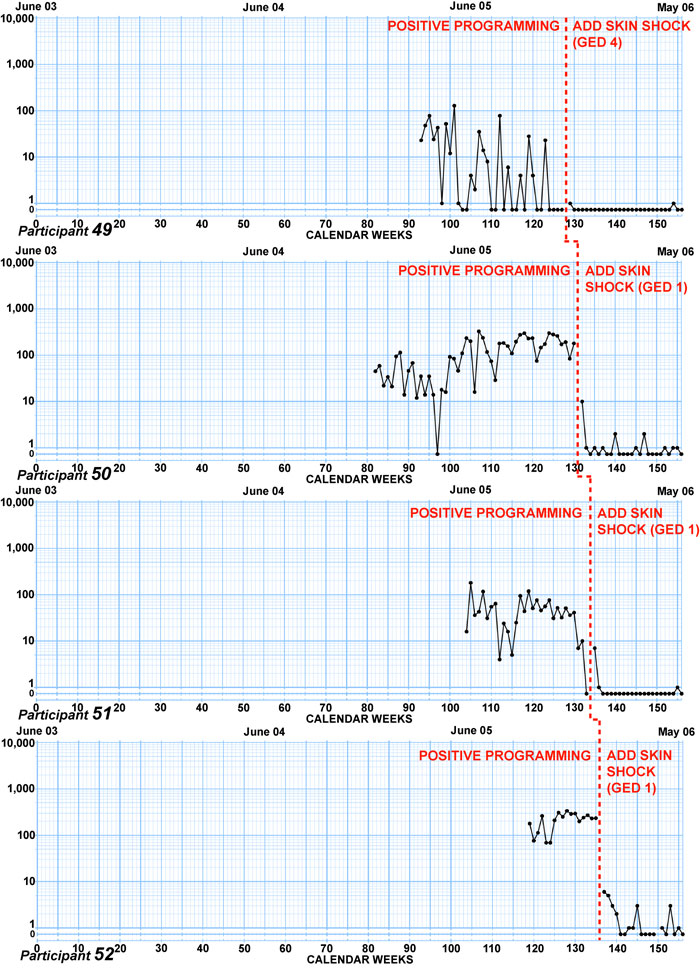
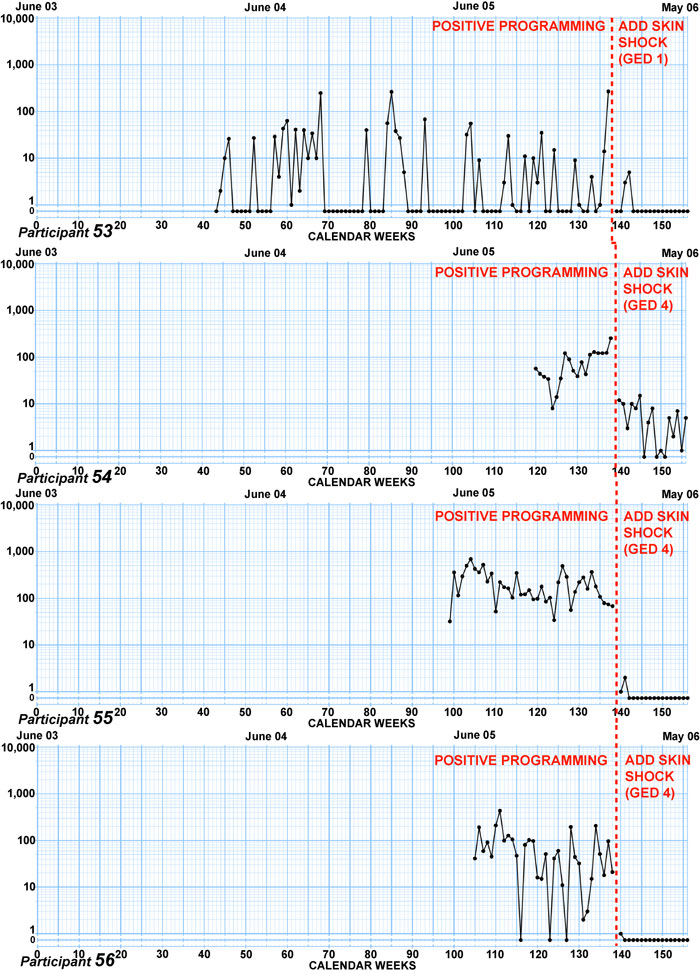
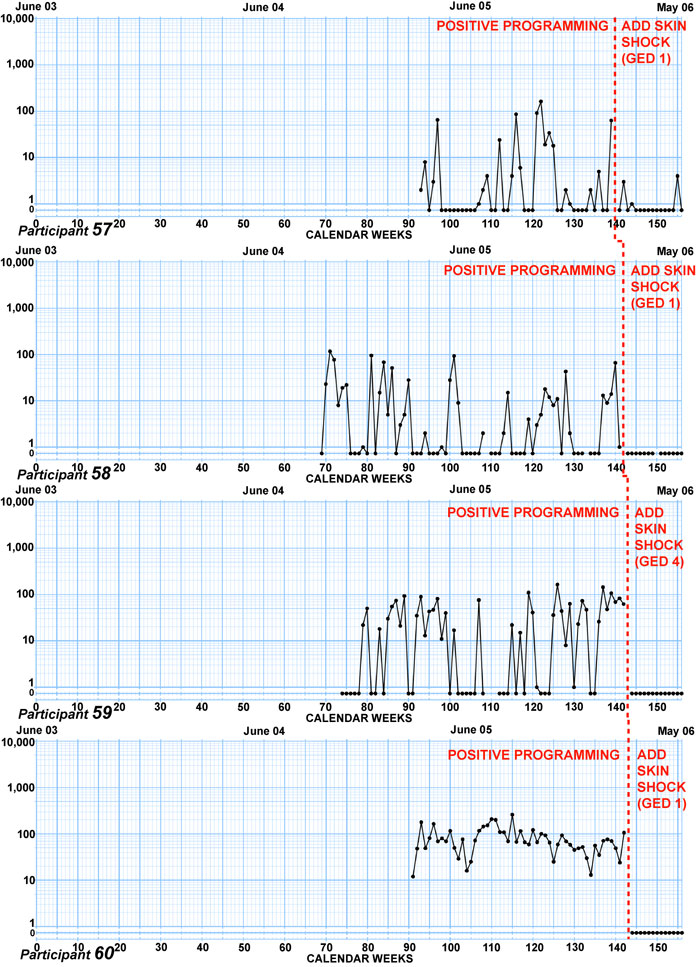
Chart display.
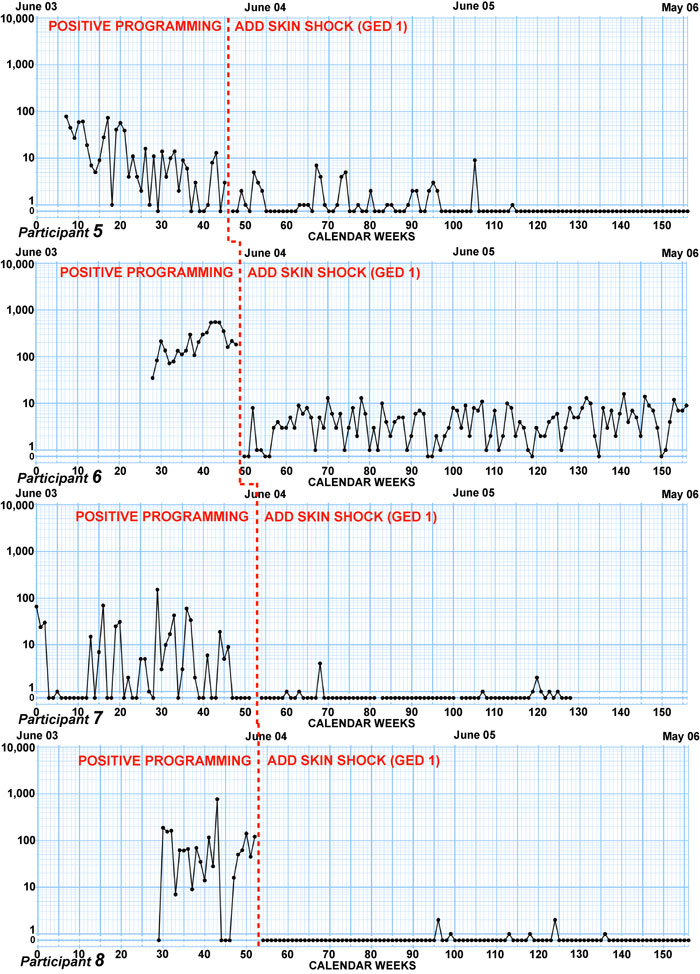
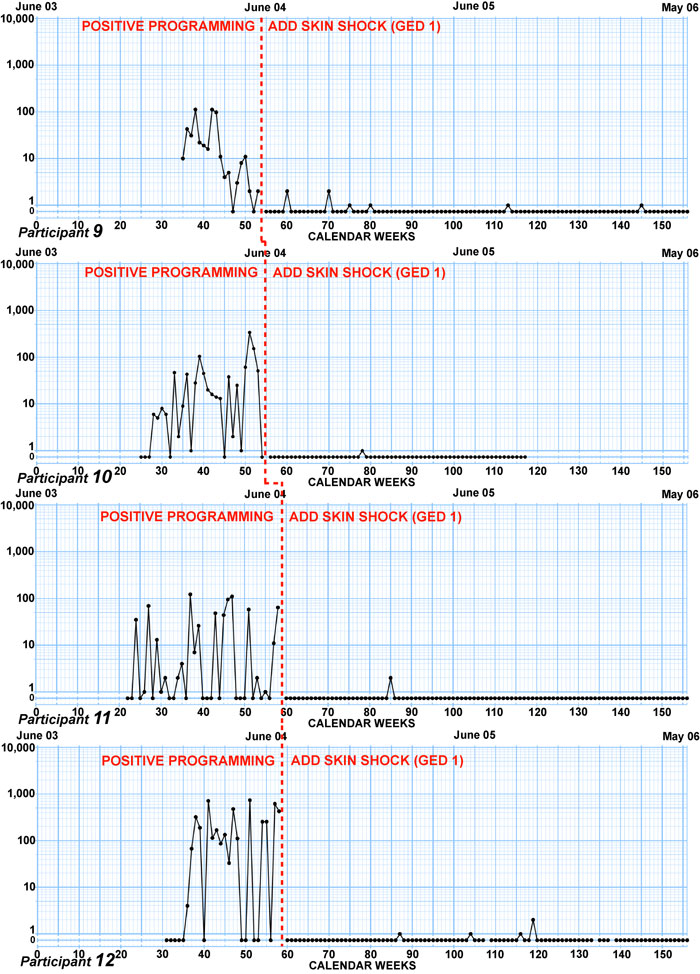
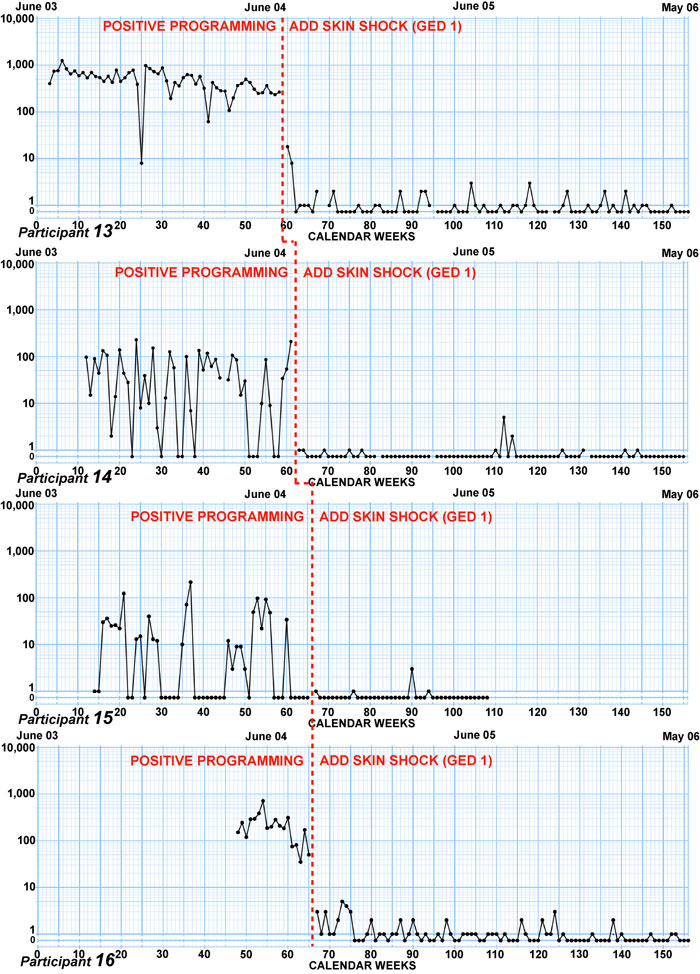
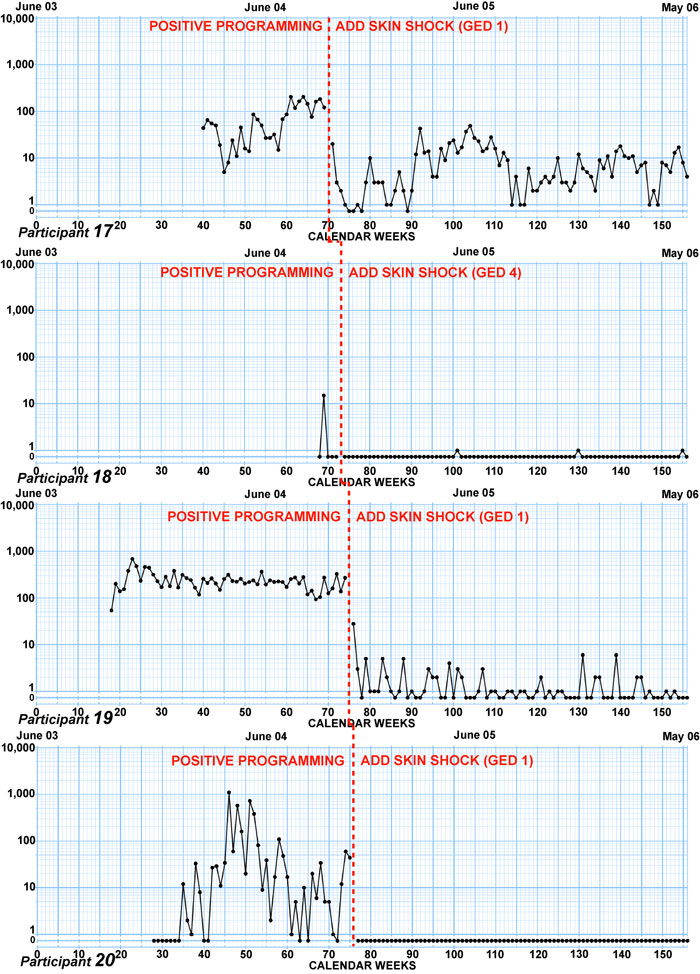
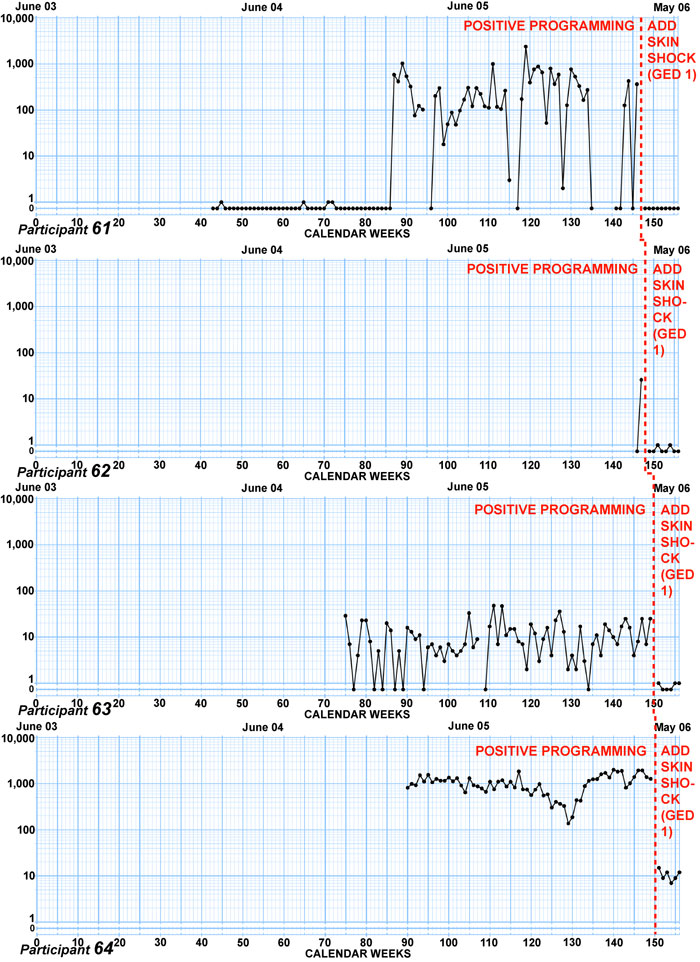
Individual charts showing
weekly totals for the participants’ aggressive behaviors are presented in Figure
1. There is one chart for each participant and each participant is identified as
Participant 1, Participant 2, etc. The charts are multiply/divide charts in
which a relative change (e.g., a doubling, tripling, or halving) occupies a
constant up-down distanc
The data point for each
“skin-shock insertion-week”—i.e., the week within which the GED procedure was
introduced—has been omitted because the total for that week, which was based on
one or more days from both the baselin
The charts ar
Casual inspection of these
charts shows that the supplemental use of the GED was effective in decelerating
aggression in almost every single case. This is particularly true when one takes
into account the fact that on these charts (when displayed at 100% size on a
computer screen) a vertical distance of approximately 6.35 mm (1/4 in) upwards
or downwards, represents a doubling or halving, respectively, of the frequency.
Figure 1.
The weekly frequency of
aggressive behaviors for each participant between


Trends during baseline
Table 2 summarizes the
trends seen during the baseline (positive programming) phase. In 42 participants
(67% of the 63 cases where there was sufficient information to characterize the
trend), the frequency was either increasing (accelerating) or flat when CSS was
introduced. In the remaining 21 cases, even though the behavior was decreasing
in frequency (decelerating), CSS was introduced because the behavior was too
dangerous to b
Table 2
Trends of aggressive
behavior during baseline
|
Description |
Total |
Participant numbers |
|
Acceleration |
24 |
2, 6, 8, 10, 11,
17, 20, 26, 28-31, 36, 40, 43, 47, 48, 50, 52, 54, 59, 61, 63, 64 |
|
Flat |
18 |
4, 7, 14, 15, 19,
21, 23-25, 27, 37-39, 42, 45, 51, 53, 58 |
|
Deceleration |
21 |
1, 3, 5, 9, 12, 13,
16, 22, 32-35, 41, 44,
46, 49, 55-57, 60, 65 |
|
Insufficient
Information |
2 |
18, 62 |
Decelerative effect of
CSS on aggressive behaviors
To analyze CSS’s decelerative effect, we examined: (1) the initial effect on frequency associated with CSS introduction; (2) the overall chart patterns found during the treatment phase; (3) the overall decelerative effect seen when all baseline data is compared with all treatment data; and (4) the changes in trends from baseline to treatment.
Initial effect on
frequency. In almost every chart in Figure 1, the GED is shown to produce
two separable effects. It causes an immediate decrease in frequency (jump down)
right after it is introduced, and this is followed by some other trend over the
succeeding weeks.2 We chose to measure these immediate jump downs by
plotting the trend (celeration) lines for both the baselin
Figure 2 shows how this was
done, for example, in the case of participant 13. The size of the jump down at
the time of CSS introduction is the same up/down distanc
Figure 2.
Sample weekly chart showing calculation of frequency jump down
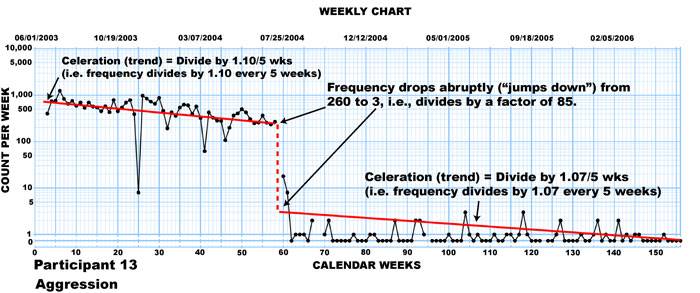
Table 3
Frequency jump downs
occurring immediately after CSS insertion (organized by magnitude)
|
Frequency jump down Immediately after CSS Insertion |
Participant Number |
|
|
Frequency jump down
Immediately after CSS Insertion
(continued) |
Participant Number (continued) |
|
||||
|
÷800 |
|
61 |
|
|
|
÷16 |
|
41 |
|
|
|
÷500 |
|
12 |
|
|
|
÷15 |
|
32 |
|
|
|
÷150 |
|
35 |
|
|
|
÷15 |
|
38 |
|
|
|
÷120 |
|
50 |
|
|
|
÷15 |
|
39 |
|
|
|
÷110 |
|
47 |
|
|
|
÷15 |
|
54 |
|
|
|
÷110 |
|
55 |
|
|
|
÷15 |
|
57 |
|
|
|
÷100 |
|
30 |
|
|
|
÷12 |
|
42 |
|
|
|
÷100 |
|
36 |
|
|
|
÷11 |
|
3 |
|
|
|
÷90 |
|
64 |
|
|
|
÷11 |
|
26 |
|
|
|
÷85 |
|
13 |
|
|
|
÷10 |
|
53 |
|
|
|
|
|
|
|
|
|
|
|
|
|
|
|
÷85 |
|
19 |
|
|
|
÷9 |
|
1 |
|
|
|
÷80 |
|
6 |
|
|
|
÷9 |
|
63 |
|
|
|
÷80 |
|
52 |
|
|
|
÷7 |
|
21 |
|
|
|
÷60 |
|
60 |
|
|
|
÷7 |
|
45 |
|
|
|
÷56 |
|
16 |
|
|
|
÷6 |
|
7 |
|
|
|
÷52 |
|
31 |
|
|
|
÷6 |
|
49 |
|
|
|
÷50 |
|
23 |
|
|
|
÷5 |
|
58 |
|
|
|
÷49 |
|
28 |
|
|
|
÷5 |
|
62 |
|
|
|
÷45 |
|
34 |
|
|
|
÷4 |
|
25 |
|
|
|
÷44 |
|
10 |
|
|
|
÷3 |
|
44 |
|
|
|
|
|
|
|
|
|
|
|
|
|
|
|
÷42 |
|
14 |
|
|
|
÷3 |
|
46 |
|
|
|
÷40 |
|
11 |
|
|
|
÷1.6 |
|
24 |
|
|
|
÷40 |
|
33 |
|
|
|
÷1.5 |
|
5 |
|
|
|
÷40 |
|
59 |
|
|
|
÷1.5 |
|
9 |
|
|
|
÷38 |
|
48 |
|
|
|
÷1.5 |
|
29 |
|
|
|
÷36 |
|
40 |
|
|
|
|
|
|
|
|
|
÷30 |
|
15 |
|
|
|
|
|
|
|
|
|
÷30 |
|
43 |
|
|
|
|
|
|
|
|
|
÷30 |
|
51 |
|
|
|
|
|
|
|
|
|
÷30 |
|
65 |
|
|
|
|
|
|
|
|
|
|
|
|
|
|
|
|
|
|
|
|
|
÷29 |
|
56 |
|
|
|
|
|
|
|
|
|
÷28 |
|
17 |
|
|
|
|
|
|
|
|
|
÷26 |
|
8 |
|
|
|
|
|
|
|
|
|
÷21 |
|
18 |
|
|
|
|
|
|
|
|
|
÷20 |
|
4 |
|
|
|
|
|
|
|
|
|
÷20 |
|
37 |
|
|
|
|
|
|
|
|
|
÷19 |
|
2 |
|
|
|
|
|
|
|
|
|
÷18 |
|
22 |
|
|
|
|
|
|
|
|
|
÷18 |
|
27 |
|
|
|
|
|
|
|
|
|
÷16 |
|
20 |
|
|
|
|
|
|
|
|
|
|
|
|
|
|
|
Median = ÷26 |
|
|
|
|
Overall chart patterns
during treatment phase. We classified
each of the charts in Figure 1 into five categories, according to the extent of
the initial jump down (i.e., whether frequency dropped to zero or not) and the
trend of the data after that point. The result of this classification is shown
in Table 4 which also shows the percent of cases that fall into each category.
Table 4
Summary of frequency patterns during treatment phase
|
|
Pattern Shown by Frequency
During Treatment Phase |
Number of Cases |
Percent of Cases |
Charts |
|
1 |
Jump
down to zero or near-zero level; then maintenanc |
53 |
81.5 |
1-4,
7-16, 18-24, 26-28, 31, 32, 34-38, 41-51, 53-55-63, 65a |
|
|
|
|
|
|
|
2 |
Jump
down to non-zero level; then
a deceleration |
5 |
7.7 |
5,
40, 52, 54, 64 |
|
|
|
|
|
|
|
3 |
Jump
down to non-zero level; then maintenanc |
3 |
4.6 |
25,
30, 33 |
|
|
|
|
|
|
|
4 |
Jumps
down to non-zero level; then acceleration |
1 |
1.5 |
6 |
|
|
|
|
|
|
|
5 |
Jumps
down to non-zero level; then alternating accelerations and
deceleration(s) |
3 |
4.6 |
29,
39, 17 |
|
|
Totals |
65 |
99.9 |
|
a
Although this classification of this
data series for participant 65 as a flat celeration at a zero frequency is based
on only five data points, examination of the next 6 weeks of data (which are
outside of the 3-year period covered in these graphs) showed that the behavior
maintained at 0 during those weeks, confirming the present classification.
In 53 cases (81.5% of the
participants), aggressive behaviors were reduced immediately to a zero or
near-zero level and remained at that level for whatever time remained in the
3-year period. In 5 cases (7.7%) the frequency jumped down and then showed a
deceleration, but had not yet reached zero within the remainder of the 3-year
period. Therefore, in 58 cases (89.2%), the behavior either jumped down to zero
or near-zero immediately, or jumped down and then decelerated toward zero. In
the remaining 7 cases (categories 3-5), although several different trends were
seen after the initial jump down, the level of aggression during the treatment
phase was substantially lower than during baseline (see next section, below) and
reflected clinically meaningful improvement.
Overall decrease in
frequency from baseline to
treatment. For each participant, we
calculated the overall mean weekly frequency of aggressive behaviors across the
entire baseline phas
Table 5
Comparison of all Baseline Weeks with All Treatment Weeks
|
Partici-pant No. |
Mean
Weekly Frequency During
Entire Baseline Period |
Mean
Weekly Frequency During Entire Treatment Period |
Reduction from Baseline (Percent) |
Reduction from Baseline (Divide-by-Factor) |
||||
|
1 |
48.14 |
|
0.21 |
|
1.00 |
|
229 |
|
|
2 |
17.03 |
|
0.02 |
|
1.00 |
|
852 |
|
|
3 |
68.61 |
|
0.11 |
|
1.00 |
|
624 |
|
|
4 |
5.10 |
|
0.07 |
|
0.99 |
|
73 |
|
|
5 |
17.56 |
|
0.59 |
|
0.97 |
|
30 |
|
|
6 |
222.77 |
|
4.67 |
|
0.98 |
|
48 |
|
|
7 |
12.40 |
|
0.18 |
|
0.99 |
|
69 |
|
|
8 |
90.79 |
|
0.08 |
|
1.00 |
|
1135 |
|
|
9 |
26.79 |
|
0.08 |
|
1.00 |
|
335 |
|
|
10 |
34.40 |
|
0.02 |
|
1.00 |
|
1720 |
|
|
|
|
|
|
|
|
|
|
|
|
11 |
19.32 |
|
0.02 |
|
1.00 |
|
966 |
|
|
12 |
167.61 |
|
0.05 |
|
1.00 |
|
3352 |
|
|
13 |
500.23 |
|
0.77 |
|
1.00 |
|
650 |
|
|
14 |
53.43 |
|
0.19 |
|
1.00 |
|
281 |
|
|
15 |
19.83 |
|
0.14 |
|
0.99 |
|
142 |
|
|
16 |
220.94 |
|
0.74 |
|
1.00 |
|
299 |
|
|
17 |
73.10 |
|
8.74 |
|
0.88 |
|
8 |
|
|
18 |
3.00 |
|
0.04 |
|
0.99 |
|
75 |
|
|
19 |
239.51 |
|
1.36 |
|
0.99 |
|
176 |
|
|
20 |
77.08 |
|
0.00 |
|
1.00 |
|
77 |
|
|
|
|
|
|
|
|
|
|
|
|
21 |
26.68 |
|
0.12 |
|
1.00 |
|
222 |
|
|
22 |
80.67 |
|
0.84 |
|
0.99 |
|
96 |
|
|
23 |
33.83 |
|
0.10 |
|
1.00 |
|
338 |
|
|
24 |
5.42 |
|
0.18 |
|
0.97 |
|
30 |
|
|
25 |
11.53 |
|
2.51 |
|
0.78 |
|
5 |
|
|
26 |
24.59 |
|
0.16 |
|
0.99 |
|
154 |
|
|
27 |
42.49 |
|
0.28 |
|
0.99 |
|
152 |
|
|
28 |
25.72 |
|
0.05 |
|
1.00 |
|
514 |
|
|
29 |
102.00 |
|
12.31 |
|
0.88 |
|
8 |
|
|
30 |
204.27 |
|
1.78 |
|
0.99 |
|
115 |
|
|
|
|
|
|
|
|
|
|
|
|
31 |
94.70 |
|
0.79 |
|
0.99 |
|
120 |
|
|
32 |
41.35 |
|
0.33 |
|
0.99 |
|
125 |
|
|
33 |
140.58 |
|
2.19 |
|
0.98 |
|
64 |
|
|
34 |
60.70 |
|
0.04 |
|
1.00 |
|
1518 |
|
|
35 |
136.42 |
|
0.28 |
|
1.00 |
|
487 |
|
|
36 |
208.14 |
|
0.04 |
|
1.00 |
|
5204 |
|
|
37 |
85.36 |
|
0.04 |
|
1.00 |
|
2134 |
|
|
38 |
4.70 |
|
0.06 |
|
0.99 |
|
78 |
|
|
39 |
94.96 |
|
7.77 |
|
0.92 |
|
12 |
|
|
40 |
174.42 |
|
5.98 |
|
0.97 |
|
29 |
|
|
Table 5 (continued) |
|
|
|
|
||||
|
Partici-pant No. |
Mean
Weekly Frequency During
Entire Baseline Period |
Mean
Weekly Frequency During Entire Treatment Period |
Reduction from Baseline (Percent) |
Reduction from Baseline (Divide-by-Factor) |
||||
|
41 |
24.26 |
|
0.13 |
|
0.99 |
|
187 |
|
|
42 |
125.46 |
|
0.03 |
|
1.00 |
|
4182 |
|
|
43 |
32.33 |
|
0.69 |
|
0.98 |
|
47 |
|
|
44 |
20.87 |
|
0.55 |
|
0.97 |
|
38 |
|
|
45 |
8.31 |
|
0.03 |
|
1.00 |
|
277 |
|
|
46 |
122.75 |
|
0.10 |
|
1.00 |
|
1228 |
|
|
47 |
101.95 |
|
0.00 |
|
1.00 |
|
102 |
|
|
48 |
55.72 |
|
0.14 |
|
1.00 |
|
398 |
|
|
49 |
16.94 |
|
0.07 |
|
1.00 |
|
242 |
|
|
50 |
121.37 |
|
0.84 |
|
0.99 |
|
144 |
|
|
|
|
|
|
|
|
|
|
|
|
51 |
47.93 |
|
0.41 |
|
0.99 |
|
117 |
|
|
52 |
213.06 |
|
1.37 |
|
0.99 |
|
156 |
|
|
53 |
16.73 |
|
0.44 |
|
0.97 |
|
38 |
|
|
54 |
79.16 |
|
5.35 |
|
0.93 |
|
15 |
|
|
55 |
216.80 |
|
0.18 |
|
1.00 |
|
1204 |
|
|
56 |
76.06 |
|
0.06 |
|
1.00 |
|
1268 |
|
|
57 |
12.81 |
|
0.50 |
|
0.96 |
|
26 |
|
|
58 |
12.54 |
|
0.00 |
|
1.00 |
|
13 |
|
|
59 |
30.33 |
|
0.00 |
|
1.00 |
|
30 |
|
|
60 |
81.19 |
|
0.00 |
|
1.00 |
|
81 |
|
|
|
|
|
|
|
|
|
|
|
|
61 |
172.94 |
|
0.00 |
|
1.00 |
|
173 |
|
|
62 |
14.50 |
|
0.25 |
|
0.98 |
|
58 |
|
|
63 |
11.19 |
|
0.50 |
|
0.96 |
|
22 |
|
|
64 |
1027.51 |
|
12.80 |
|
0.99 |
|
80 |
|
|
65 |
16.87 |
|
0.00 |
|
1.00 |
|
17 |
|
|
|
Median = 53.43 |
Median = 0.18 |
Median = 99% |
Median = ÷ 142 |
||||
Note:
When the treatment weekly mean was equal to zero, the number 1 was substituted
in order to calculate the factor by which the treatment mean was reduced. This
was the case for participants 20, 47, 58, 59, 60, 61, and 65.
Table 6
Percent of participants achieving certain percentage reductions
|
Percent Reduction |
Number of Participants |
Cumulative Number at or above
this Percent Reduction |
Cumulative Percent at or above this Percent Reduction |
|
100 |
32 |
32 |
49.2 |
|
99 |
17 |
49 |
75.3 |
|
98 |
4 |
53 |
81.5 |
|
97 |
5 |
58 |
89.2 |
|
96 |
2 |
60 |
92.3 |
|
95 |
|
|
|
|
94 |
|
|
|
|
93 |
1 |
61 |
93.8 |
|
92 |
1 |
62 |
95.4 |
|
91 |
|
|
|
|
90 |
|
|
|
|
|
|
|
|
|
88 |
2 |
64 |
98.4 |
|
|
|
|
|
|
78 |
1 |
65 |
100.0 |
|
|
|
|
|
Comparison of percentage reduction found in this study with those found in treatment outcome reviews. We compared the percentage reduction that we found in the present study with those reported in two treatment outcome reviews: (1) one by Cataldo (1991), who evaluated published studies (1965-1989) in which punishment was used to treat problem behaviors; and (2) one by Carr et al. (1999) who evaluated published studies (1995-1996) in which Positive Behavior Support procedures were use used to treat problem behaviors. The results, including the methods for calculating percentage reduction are shown in Table 7.
Table 7
Percentage Reductions Reported in Present Study and Two Other Treatment Outcome Reviews
|
Report |
Type of Study |
No. of Partici-pants/Out-comesa Evaluated re Treatment of
Aggression |
Treatment Methods |
Method of Calculating Percentage Reduction |
What Percent of Participants/Outcomes Achieved a Reduction of 90% or
more? |
|
|
|
|
|
|
|
|
Cataldo (1991) |
Treatment outcome review of 137
punishment studies, 1965-1989 |
4
partici-pants |
CSS
employed with one or more other interventions. |
Mean
of all baseline data compared with mean of last 3 treatment data |
50.0% |
|
|
|
|
|
|
|
|
Carr
et al. (1999) |
Treatment outcome review of 109 Positive Behavior Support studies,
1985-1996 |
90
out-comes |
Positive behavioral procedures only |
Mean
of last 3 baseline data compared with mean of last 3 treatment data |
55.5% |
|
|
|
|
|
|
|
|
|
Treatment of 65 participants using multiple baseline design, |
65
partici-pants |
Positive behavioral procedures plus CSS |
Mean
of last 3b baseline weeks compared with mean of last 3
treatment weeks |
100%c |
|
|
|
|
|
|
|
a
Carr (1999) evaluated
“outcomes,” not participants. If a single subject study used time out, then
ignoring and then skin shock in three successive phases, this was counted as 3
outcomes. The Carr report does not provide information as to how many
participants were involved in the 90 outcomes in which Positive Behavior Support
procedures were employed to treat aggression.
bFor
participants 2, 4, 7, 15, 18, 24, 45, 49, and 65 the mean of the last 3 weeks
was equal to zero. For those cases, the entire baseline mean was substituted in
order to calculate the percent reduction.
c Actually, when reduction
percentage is calculated by comparing end-of-treatment with end-of-baseline, as
was done for both the Carr et al. data and the
Changes in trends (slope
of acceleration or deceleration) befor
For 53 of the participants
there was no opportunity to examine the celeration Turns because their charts
show a Jump Down to zero or near-zero frequencies at CSS insertion. Of the
remaining 12, Table 8 describes each participant’s treatment data by the Jumps
and Turns that occur. Each major change effect is labeled as to week number, and
is characterized by its Jump (a
“Jump Up,” “Jump Down” or “No Jump”) and celeration Turn (a “Turn Up,” “Turn
Down,” or “No Turn.”). In each description, the effect that occurred immediately
after CSS was inserted is described first. If there wer
As can be seen in Table 8,
the decelerative power of CSS is evidenced by the Jumps and Turns that occurred
right after CSS was first inserted. All 12 showed Jump Downs at CSS insertion.
And after those Jumps, only 1 of the 12 participants showed a celeration Turn
Up, 5 showed no change in trend (i.e., showed No Turns) and 6 showed celeration
Turn Downs.
Table 8
Changes in Frequency
Jumps and Celeration Turns after CSS Insertion for Participants who did not Show
Jump Downs to Zero or Near-zero
|
Participant # |
Change Effect Description |
|
6 |
Jump Down, Turn
Down (wk 49); |
|
|
|
|
17 |
Jump Down, No Turn
(wk 70); No Jump, Turn Down (wk 104); No Jump, Turn Up (wk 117) |
|
|
|
|
25 |
Jump Down, No Turn
(wk 93) |
|
|
|
|
29 |
Jump Down, Turn
Down (wk 95); No Jump, Turn Down (wk. 116, at change from GED-1 to
GED-4) |
|
|
|
|
30 |
Jump Down, Turn
Down (wk 96) |
|
|
|
|
33 |
Jump Down, No Turn
(wk 104) |
|
|
|
|
39 |
Jump Down, Turn Up
(wk 109); No Jump, Turn Down (wk 135, during treatment) |
|
|
|
|
40 |
Jump Down, Turn
Down (wk 114) |
|
|
|
|
52 |
Jump Down, Turn
Down (wk 136) |
|
|
|
|
54 |
Jump Down, Turn
Down (wk 139) |
|
|
|
|
64 |
Jump Down, Turn
Down (wk 150) |
Comparison of overall
improvement of high and low functioning participants
We divided the participants
into two groups according to level of cognitive functioning and compared the
improvement of the two groups. We used two different methods for classifying
each participant as either higher or lower functioning, and analyzed the data
separately for each method.
Results when MR
diagnosis was used to classify participants.
In Table 9, the improvement shown by participants who had been diagnosed with MR
is compared with those who were not so diagnosed. For the 35 participants
without an MR diagnosis, the medians of their individual mean weekly
frequencies during baselin
Table 9
Improvement of MR and
Non-MR Participants
|
|
MR |
Non-MR |
|
1.
No. of Participants |
35 |
30 |
|
|
|
|
|
2. Median of the
Individual Mean Weekly Frequencies (All Baseline Weeks) |
95.0 |
44.5 |
|
|
|
|
|
3. Median of
Individual Mean Weekly Frequencies (All Treatment Weeks) |
0.59 |
0.13 |
|
|
|
|
|
4. Overall
Reduction from Baseline (Divide-by-Factor) Calculated as Row 2 divided
by Row 3 |
161 |
342 |
|
|
|
|
|
5. Overall
Reduction from Baseline (Percent) |
99.4% |
99.7% |
|
|
|
|
|
6. Percent
Achieving 100% Overall Reduction |
40% |
60% |
|
|
|
|
|
7. Percent
Achieving 95% or Greater Overall Reduction |
86% |
100% |
|
Superiority of
CSS with Non-MR group = 342
÷ 161 or ≈ 2 times greater
overall reduction from baseline |
||
Results when
conversation skill was used to classify participants.
As a second approach, we ignored the
participants’ diagnoses, and classified them informally as either higher or
lower functioning according to whether or not they could carry on a meaningful
conversation with a normal adult. Five JRC staff members, who knew the students
well and who were unaware of the purpose of the categorizations, made these
judgments independently. The final assignment of each student to a group was
determined by majority decision.
The results based on this
conversational skills standard are presented in Table 10. A total of 44
participants were judged to be high functioning by this standard. They engaged
in a median (of the individual mean weekly frequencies) of 32 aggressive
behaviors during the baseline period and a median (of the individual mean weekly
frequencies) of 0.07 aggressive behaviors during the treatment period. This
represented an improvement (reduction) by a factor of 457.1. The 21 participants
who were judged to be low functioning by this conversation skills standard
displayed a median (of their individual mean weekly frequencies) of 95 per week
and 1.36 per week, respectively, during baselin
An overall reduction of
100% was achieved by only 17% of the low functioning group, but by 64% of the
high functioning group. A reduction of 95% or greater was achieved by 78% of the
low functioning group, but by 100% of the high functioning group.
Table 10
Improvement of Low and
High Functioning Participants (Using an Informal Judgment of Conversation Skills
to Determine Level of Functioning)
|
|
Low |
High |
|
1.
No. of Participants |
21 |
44 |
|
|
|
|
|
2. Median of the
Individual Mean Weekly
Frequencies (All Baseline Weeks) |
95 |
32 |
|
|
|
|
|
3. Median of the
Individual Mean Weekly Frequencies (All Treatment Weeks) |
1.36 |
0.07 |
|
|
|
|
|
4. Overall:
Reduction from Baseline (Divide-by-Factor) Calculated as Row 2 divided
by Row 3 |
69.9 |
457.1 |
|
|
|
|
|
5.
Overall: Reduction from Baseline (Percent) |
98.6 |
99.8 |
|
|
|
|
|
6. Percent
Achieving 100% Overall Reduction |
17 |
64 |
|
|
|
|
|
7. Percent
Achieving 95% or Greater Overall Reduction |
78 |
100 |
|
Superiority of
CSS with high functioning group =
457.1 ÷ 69.9 or ≈ 7
times greater overall reduction from baseline. |
||
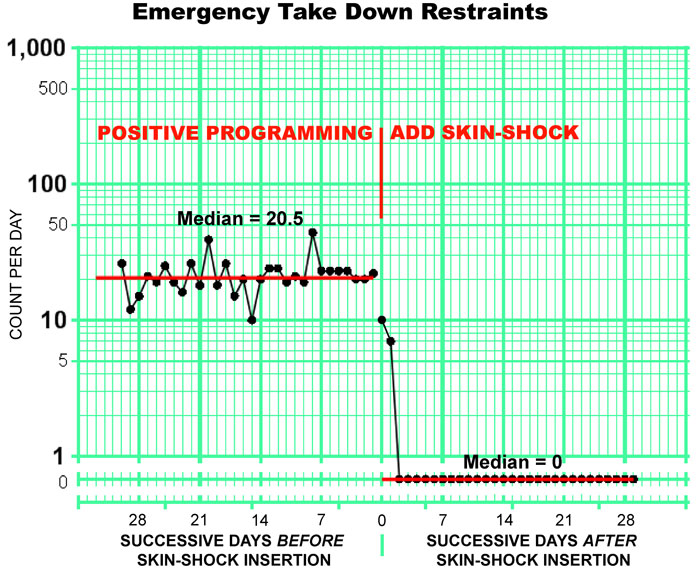
Need for emergency
takedown restraints befor
We compared the number of
emergency takedown restraints that participants underwent during the 30 days
immediately prior to CSS introduction with the number they underwent during the
30 days immediately after CSS introduction. Figure 3 shows this data. Figure 3
does not show successive calendar days on its horizontal axis. This axis shows
days prior to, and subsequent to, CSS insertion. Irrespective of on what
calendar day, during the 3-year period, each takedown restraint occurred, we
totaled, across all 65 participants, all emergency takedown restraints that
occurred on the 1st day before CSS introduction, all that
occurred on the 2nd day before CSS introduction, etc. The data
point immediately to the left of the intervention line in Figure 3
represents the total for the 1st day before CSS introduction, the
data point that is second to the left from the intervention line is for the 2nd
day before CSS intervention, etc. W
The participants, as a
group, had a median of 20.5 emergency takedown restraints per day during the
last 30 days before CSS introduction and a median of 0 emergency takedown
restraints per day during the first 30 days after CSS introduction. Because each
takedown restraint involved the joint action of 2-8 staff members, as well as
one other staff member whose only role was to observe the restraint, and because
each instance was recorded on a restraint form at the time of the restraint,
measures to insure interobserver reliability were not deemed necessary.
Figure 3.
Emergency takedown restraints for the
30 days before and after the addition of skin-shock.
Use of Psychotropic
Medication
Fifty-two of the 65
participants (80%) were taking a total of 170 psychotropic medications when they
enrolled at JRC. We measured the total number of participants taking
psychotropic medications and the number of medications they were taking at the
following points in time: (1) when the participants enrolled at JRC (2) when CSS
was introduced; and (3) when the participants left JRC, or
Table 11
Use of psychotropic
medications
|
|
On
Date of Enrollment |
On
Date of CSS Insertiona |
On
Departure Date or |
||||
|
|
No. |
Percent of all 65 participants |
No. |
Reduction (Percent) |
No. |
Reduction (Percent) |
Reduction
(Divide-by-Factor) |
|
Number of
participants taking psychotropic medications |
52 |
80.00% |
19 |
63.46% |
3 |
94.23%b |
54/3
= ÷17.3 |
|
|
|
|
|
|
|
|
|
|
Number of
psychotropic medications being taken. |
170 |
|
46 |
72.94% |
4 |
97.64%c |
170/4 = ÷42.5 |
aIn
those cases in which the GED-1 was used
first and was later switched to the GED-4, the date of the GED-1 insertion was
used. bOne participant stopped receiving CSS treatment on
Comparison of injuries to
staff members befor
We compared the number of injuries that the participants caused to staff
members by their aggressive behaviors during baseline with the number they
caused during treatment. These were significant injuries that required nursing
or other medical attention. For example, during baseline the following injuries
were recorded: bites (56), contusions (bruises) (42), strains (19), head
injuries (11), sprains (10), lacerations (4), pains (4), abrasions (3),
headaches (2), temporomandibular joint problem (1), exposure to blood-born
pathogens exposure (1), nasal injury (1), nasal fracture (1), tooth fracture
(1), cracked tooth (1). The data is shown in Table 12. Injuries decreased from
157 before CSS insertion to only 8 after. The number of injuries per
participant-month, after CSS insertion, decreased by a factor of 24, which was a
96% reduction.
Table 12
Aggression-caused
injuries to staff members
|
|
No.
of Staff Injuries Caused by Participants |
No.
of ParticipantMonths |
Injuries per ParticipantMonth |
|
Baseline phase |
157 |
653 |
0.2214 |
|
Treatment phase |
8 |
806 |
0.0088 |
|
Decrease
(divide-by-factor) |
|
|
≈ ÷
24 |
|
Decrease (percent) |
|
|
96% |
Discussion
This retrospectiv
The only two treatment
outcome reviews that hav
In the present study,
positive behavioral education and treatment, supplemented by CSS, proved to b
The finding that the
positive programming/CSS combination used in the present study almost doubled
the effectiveness (in terms of the percentage that reached the 90% or greater
reduction standard) that was found in the Positive Behavior Support papers
reviewed by Carr et al. is important because many persons and agencies—such as
TASH and the Association for Positive Behavior Support—assert that even the most
severe problem behaviors can be effectively treated with Positive Behavior
Support methods alone (TASH, n.d.; APBS, 2007). Using or choosing a treatment
that is 50% less effective than would otherwise be possible might be justified
if th
Because the number of GED
applications was always fewer than the number of aggressive behaviors that were
tallied, Table 1 can be used to set an outside limit on the number of GED
applications that wer
The failure to find
significant adaptation in most of the participants is noteworthy. For almost all
participants, aggressive behaviors remained at a low level, or continued to
decelerate over time, even when the CSS contingency remained in place for
periods of up to three years. This finding is significant in light of previous
reports of adaptation associated with SIBIS, the skin-shock device that has been
used in most CSS studies during the past 17 years (e.g., Ricketts, Goza, &
Matese, 1993; Williams, Kirkpatrick-Sanchez, & Iwata, 1993).
A possible limitation of
this study was the lack of interobserver reliability. Due to financial
considerations, these measures were not obtained. However, it is important to
note that those who counted aggressive behaviors completed a significant amount
of training and there were various mechanisms within the program to maintain
treatment integrity, including liv
Although a study of the removal (fading) of the GED device was beyond the
scope of this report, fading was accomplished with many of the participants. As
their behaviors improved, the requirement that the GED device be worn was
gradually diminished. If participants had been wearing more than one GED, the
number was gradually reduced to just one. At that point, and in cases where the
participant had always been using only one device, the number of hours each day
during which the device was worn was gradually reduced to zero.
As of
Our results suggest that CSS
was effective not only with lower functioning individuals, such as those with
severe or profound retardation and autism, but also with individuals with normal
or near-normal cognitive functioning. When presence or absence of an MR
diagnosis was used to determine level of functioning, CSS proved to b
This finding that CSS was
more effective with the higher functioning participants may be true of other
punishers as well. Foxx and Livesay (1984), for example, found that “higher
functioning individuals treated with overcorrection showed longer and better
treatment effects than lower functioning individuals”(Foxx, 2003, p.11). A more
detailed analysis of the differential effect of CSS on individuals with
differing cognitive levels and verbal skills merits future study.
Detection of the superior
overall decelerative effect of CSS on th
The practice of employing
skin-shock with “higher functioning” individuals has been criticized by some.
These concerns should be weighed, however, against the fact that some of the
higher functioning participants in the present study, unlike many of the lower
functioning participants, have been able, with the temporary help of this
treatment, to turn their lives around, live independently and become future
taxpayers. Many of them function at a level where they can discuss their
treatment and reflect on its value to them, something several of them have don
Despite the fact that w
Th
The procedures used in this
study eliminated the need to use emergency takedown restraint with the
participants. The number of such restraints, when totaled across the entire
group of 65 participants, dropped from a median of 20.5 per day before CSS
introduction to a median of 0 per day after. Each such restraint lasted between
20 and 120 minutes and involved from 2-8 staff members. From the participant’s
perspective, the elimination of such takedowns avoided the humiliation that can
be involved in undergoing them, and resulted in large savings of time that could
now be devoted to classroom learning instead of to being restrained on the
floor.
By eliminating the need for
emergency takedown restraints, CSS treatment enhanced the participants’ safety
by enabling them to avoid a procedure which, when not carried out properly, can
be dangerous. The reported number of deaths in the
Our data also shows that the
type of behavioral treatment reported here made it unnecessary, in most cases,
to continue to use psychotropic medication to control aggression. This fact also
enhanced the safety of the participants in this study. Chyka (2000) summarized
the number of deaths caused by adverse drug reactions (to psychotropic
medications) in 1995 as reported by the US Food and Drug Administrations (FDA).
He found that 848 people died as a result of such reactions. This number does
not include deaths or other injuries due to human error in medication
administration.
It should be noted that
these two dangerous procedures—psychotropic drugs and emergency takedown
restraint—both of which can b
Anecdotally, we observed
other positive side effects. Once the participants’ aggression diminished, a
cascade of other positive results began to follow naturally. Participants began
succeeding, sometimes for the first time, in passing their behavioral contracts.
As a result, they began to earn more rewards, advance to residences and
classrooms with more privileges, and generally improve their quality of life.
Their parents and siblings began to take them hom
Paradoxically CSS, whos
The beneficial effects of
supplementary CSS treatment were so clear that some participants in this study
asked to b
If an individual’s
repertoire is too filled with aggressive or other inappropriate behaviors, it
can be difficult if not impossible to teach that person much in the way of new
skills. In that respect, effective use of aversives functions for some
participants as a “gateway” to the use of positive programming in that it
enables such programming to occur for the first time. As
Every surgical, dental, or
medical treatment involves discomfort, risks, or costs on the one hand, and
expected benefits on the other. For most persons, a reasonabl
There exists a very small
population of individuals who engage in severe problem behaviors that do not
respond to typical forms of behavioral intervention or to pharmacological
interventions. Although some individuals may prove to hav
References
Alford, G. S., & Turner, S.
M. (1976). Stimulus interferenc
Association for
Positive Behavior Support. (2007, February)
PBS Standards of Practice: Individual
Level. Retrieved
Ball, T., Sibbach, L.,
Jones, R., Steele, B., & Frazier, L. (1975). An accelerometer-activated device
to control assaultiv
Baumeister, A. A., &
Forehand, R. (1972). Effects of contingent shock and verbal command on body
rocking of retardates. Journal of Clinical Psychology, 28, 586-590.
Birnbrauer, J. S. (1968).
Generalization of punishment effects--a case study. Journal of Applied
Behavior Analysis, 1, 201-211.
Brandsma, J. M., & Stein, L.
I. (1973). The use of punishment as a treatment modality: A case report. The
Journal of Nervous and Mental Disease, 156(1), 30-37.
Browning, R. M. (1971).
Treatment effects of a total behavior modification program with fiv
Bucher, B., & Fabricatore,
J. (1970). Use of patient-administered shock to suppress hallucinations.
Behavior Therapy, 1, 382-385.
Bucher, B., & King, L. W.
(1971). Generalization of punishment effects in the deviant behavior of a
psychotic child. Behavior Therapy, 2, 68-77.
Carr, E. G., & Lovaas, O. I.
(1983). Contingent electric shock as a treatment for severe behavior
problems. In S. Axelrod & J. Apsche
(Eds.), The Effects of Punishment on Human Behavior, (pp.
221-245).
Carr, E. G., Horner, R. H.,
Turnbull, A. P., Marquis, J. G., Magito McLaughlin, D., McAtee, M.
L., Smith, C. E., Anderson
Ryan, K., Ruef, M. B., & Doolabh, A. (1999). Positive behavior support
for people with developmental disabilities:
A research synthesis.
Cataldo, M. (1991). The effects of punishment
and other behavior reducing procedures on the destructive behaviors of persons
with developmental disabilities. In D. B. Gray & T. Thompson (Eds.),
Treatment of destructive behaviors in persons with developmental disabilities,
(NIH Publication No. 91-2410) (pp. 231-341).
Chyka, P.A. (2000). How many deaths occur
annually from adverse drug reactions in the
Conner, M.G. (2006). Excited Delirium,
Restraint Asphyxia, Positional Asphyxia and "In-Custody Death" Syndromes:
Controversial theories that may explain why some children in treatment programs
die when restrained
Retrieved
Cunningham, C. E., &
Linscheid, T. R. (1976). Elimination of chronic infant ruminating by
electric shock. Behavior Therapy, 7, 231-234.
Duker, P.C., & Seys, D.M.
(1996). Long-term use of electrical aversion treatment with
self-injurious behaviors. Research in Developmental Disabilities, 17,
293-301.
Duker, P.C., & Seys, D.M.
(2000). A quasi-experimental study on the effect of electrical aversion
treatment on imposed mechanical restraint for severe self-injurious behavior.
Research in
Developmental disabilities, 21, 235-242.
Foxx, R.M. (2003). Treatment
of dangerous behavior. Behavioral Interventions, 18, 1-21.
Foxx, R.M. & Livesay, J.
(1984). Maintenance of Response Suppression Following Overcorrection: A 10-Year
Retrospective Examination of Eight Cases. Analysis and Intervention in
Developmental Disabilities, 4 (1), 65-79.
Foxx, R., Bittle, R., & Faw,
G. (1989). A maintenance strategy for discontinuing aversive procedures: A
52-month follow-up of the treatment of aggression. American Journal of Mental
Retardation, 94(1), 27-36.
Foxx, R. M., McMorrow, M.
J., Bittle, R. G., & Bechtel, D. R.
(1986). The successful treatment of a dually-diagnosed deaf man's aggression
with a program that included contingent electric shock.
Behavior
Therapy, 17, 170-186.
Foxx, R.M., Zukotynski, G.,
Williams, D.E. (1994). Measurement and Evaluation of treatment outcomes with
extremely dangerous behavior. In T.Thompson & D.B. Gray (Eds.), Destructive
behavior in developmental disabilities. (pp 261-273). Sage:
Hamilton, J., & Standahl, J.
(1969). Suppression of stereotyped screaming behavior in a profoundly retarded
institutionalized female. Journal of Experimental Child Psychology, 7,
114-121.
(2006). “Replacing”
problem behavior: An analysis of tactical alternatives.
The Behavior Analyst, 29, 1-11.
Kircher, A. S., Pear, J. J.,
& Martin, G. L. (1971). Shock as punishment in a picture-naming task with
retarded children. Journal of Applied Behavior Analysis, 4(3), 227-233.
Kohlenberg, R. J. (1970).
The punishment of persistent vomiting: A case study. Journal of Applied
Behavior Analysis, 3(4), 241-245.
Lebow, M. D., Gelfand, S., &
Dobson, W. R. (1970). Aversive conditioning of a phenothiazine-induced
respiratory stridor. Behavior Therapy,
1, 222-227.
Lindsley, O.R.
(1990). Our Aims, Discoveries, Failures and Problem. Journal of Precision
Teaching, 2(2), 7-17.
Lindsley, O.R. (1964). Direct
Measurement and Prosthesis of Retarded Behavior, Journal of Education, 147,
62-81.
Linscheid, T. R., Iwata, B.,
Ricketts, R., Williams, D., & Griffen, J. (1990). Clinical evaluation of the
Self-Injurious Behavior Inhibiting System (SIBIS). Journal of Applied
Behavior Analysis, 23, 53-78.
Linscheid, T. R., Pejeau,
C., Cohen, S., & Footo-Lenz, M.
(1994). Positive side effects in the treatment of SIB using the Self-Injurious
Behavior Inhibiting System (SIBIS): Implications for operant and biochemical
explanations of SIB. Research in Developmental
Disabilities, 15(1), 81-90.
Linscheid, T.R. &
Reichenbach, H. (2002). Multiple factors in the long-term effectiveness of
contingent electric shock treatment for self-injurious behavior: a case example.
Research in
Developmental Disabilities, 23, 161-177.
Lovaas, O. I., Schaeffer,
B., & Simmons, J. Q. (1965). Building social behavior in autistic children by
use of electric shock. Journal of Experimental Research in Personality, 1,
99-109.
Ludwig, A. M., Marx, A. J.,
Hill, P. A. & Browning, R. M. (1969), The control of violent behavior through
faradic shock. The Journal of Nervous and Mental Disease, 148(6),
624-637.
Matson, J., &
Mudford, O.C., Boundy, K., &
Murray, A. D. (1995). Therapeutic Shock Device (TSD): Clinical Evaluation with
Self-Injurious Behaviors. Research in Developmental Disabilities, 16(4),
253-267.
Pennypacker, H.S., Guiterrez, A., & Lindsley, O. R. (2003).
Handbook of the Standard Celeration Chart.
Ricketts, R.W., Goza A.B., &
Matese, M. (1993). A 4-year follow-up on treatment of self-injury.
Journal of Behavior Therapy and Experimental Psychiatry, 24,
57-62.
Risley, T. R. (1968). The
effects and side effects of punishing th
Salvy, S., Mulick, J.A.,
Butter, E.,
Skinner, B.F. (1953).
Scienc
Skinner, B.F. (1958).
Teaching machines. Science, 128, 969-77.
Skinner, B.F. (1969).
Contingencies of reinforcement: A theoretical analysis.
TASH. (n.d.).
Positive Behavior Supports.
Retrieved
Toister, R., Condron, C.,
Worley, L., & Arthur, D. (1975). Faradic therapy of chronic vomiting in
infancy: A case study. Journal
of Behavior Therapy and Experimental Psychiatry, 6, 55-59.
Turner, S., Hersen, M., &
Bellack, A. S. (1977). Effects of social disruption, stimulus interference, and
aversive conditioning on auditory hallucinations. Behavior Modification, 1,
249-258.
van Oorsouw, W.M.W.J.,
Williams, D. E.,
Kirkpatrick-Sanchez, S., & Iwata, B. A. (1993). A comparison of shock intensity
in the treatment of longstanding and severe self-injurious behavior. Research
in Developmental
Disabilities, 14, 207-219.
Wright, D., Brown, R., &
Andrews, M. (1978). Remission of
chronic ruminative vomiting through a reversal of social contingencies.
Behavior Research & Therapy, 16, 134-136.
Wright, L.
(1973). Aversive conditioning of self-induced seizures. Behavior Therapy, 4,
712-713.
Appendix
The Weekly Frequency of
Aggressive Behaviors at the Intervention Insertion Week for each Participant.
|
Participant |
Intervention Week |
|
|
1 |
9 |
|
|
2 |
10 |
|
|
3 |
25 |
|
|
4 |
0 |
|
|
5 |
1 |
|
|
6 |
182 |
|
|
7 |
3 |
|
|
8 |
77 |
|
|
9 |
13 |
|
|
10 |
69 |
|
|
11 |
3 |
|
|
12 |
0 |
|
|
13 |
243 |
|
|
14 |
16 |
|
|
15 |
1 |
|
|
16 |
170 |
|
|
17 |
27 |
|
|
18 |
19 |
|
|
19 |
98 |
|
|
20 |
30 |
|
|
21 |
3 |
|
|
22 |
3 |
|
|
23 |
219 |
|
|
24 |
0 |
|
|
25 |
5 |
|
|
26 |
1 |
|
|
27 |
0 |
|
|
28 |
0 |
|
|
29 |
44 (15) |
|
|
30 |
223 |
|
|
31 |
21 (0) |
|
|
32 |
7 |
|
|
Participant |
Intervention Week |
|
|
33 |
94 |
|
|
34 |
1 |
|
|
35 |
48 |
|
|
36 |
1 |
|
|
37 |
2 |
|
|
38 |
3 |
|
|
39 |
50 |
|
|
40 |
200 |
|
|
41 |
0 |
|
|
42 |
23 |
|
|
43 |
17 |
|
|
44 |
0 |
|
|
45 |
0 |
|
|
46 |
36 |
|
|
47 |
19 |
|
|
48 |
13 |
|
|
49 |
0 |
|
|
50 |
60 |
|
|
51 |
7 |
|
|
52 |
33 |
|
|
53 |
2 |
|
|
54 |
43 |
|
|
55 |
68 |
|
|
56 |
24 |
|
|
57 |
3 |
|
|
58 |
5 |
|
|
59 |
39 |
|
|
60 |
16 |
|
|
61 |
962 |
|
|
62 |
3 |
|
|
63 |
27 |
|
|
64 |
241 |
|
|
65 |
0 |
|
Note:
Participants 29 and 31, who were switched from
GED to GED-4, have two intervention insertion weeks. The frequency of aggressive
behaviors in the second intervention insertion week is presented in parentheses.
Author Contact Information
Matthew L.
email: m.israel@judgerc.org
Nathan A. Blenkush
email: n.blenkush@judgerc.org
Robert E. von Heyn
email: r.vonheyn@judgerc.org
Patricia M. Rivera
email: p.rivera@judgerc.org
Author Note
Matthew L.
We thank Hank Pennypacker, Christie Perrone, and Glenda
Crookes for their helpful comments and suggestions regarding this paper, and
Steve Graf for his comments and assistance in the chart analysis. W
Correspondence concerning this paper should be sent to:
Matthew L.
Footnotes
1
On the charts of Figure 1, a data series that
doubles every 5 weeks produces a slope of 34 degrees. On the weekly
version of the Standard Celeration Charts, a doubling every month
produces the same slope.
2This observation was first
brought to our attention by the late O.R. Lindsley, who also developed the
precision teaching technology on which we have based much of our charting scheme
and data analysis.