

SIBIS OR
NON-SHOCK AVERSIVES
GED
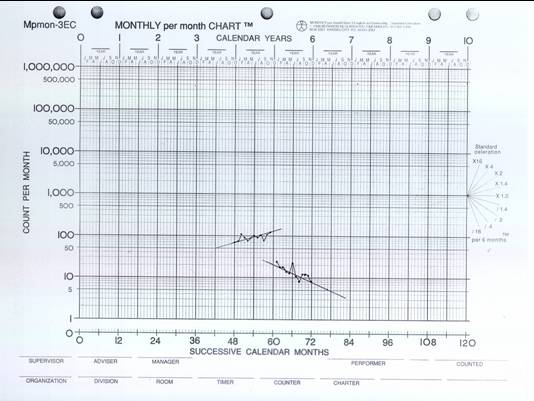
1. Celeration = X1.5
During the 12 months before GED was used,
the behaviors were increasing, multiplying by a factor of
1.5 every 6 months.
2. Jump Down = ÷5.0
When GED was first applied the frequency of the
behaviors
decreased immediately(“jumped down”)
by a factor 5.0.
3. Celeration = ÷1.6
During the first 11 months of GED use,
the behaviors decreased, dividing by
a factor of
1.6every six months.


Health
Dangerous
Each dot represents the median monthly totals for 36
students. Chart shows the 12 months before and 11 months after GED was
introduced.
Introduction dates differed among students and occurred
during the period December, 1990 to February, 1992.
