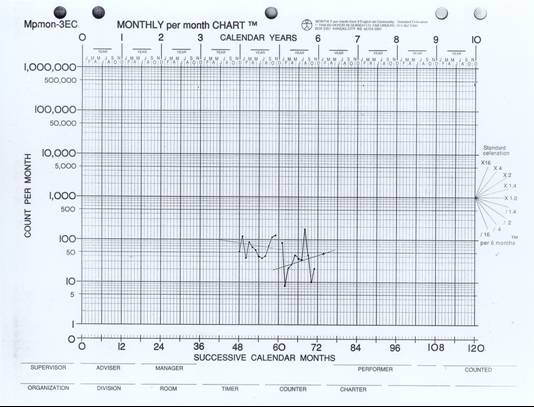

HEALTH DANGEROUS
BEHAVIOR BEFORE AND AFTER SIBIS INTRODUCTION
Median Monthly Totals
for 9 Students
BEFORE
SIBIS
(REWARDS PLUS
NON-SHOCK AVERSIVES)
SIBIS

1.
Celeration =÷1.2
During
the 12 months before SIBIS
was used, the behaviors
were decreasing, dividing
by the factor of 1.2 every
six months.
2. Jump Down = ÷ 2.0
When SIBIS was first applied the frequency of the behaviors decreased immediately (“jumped down”) by a factor of 2.0 (50% reduction).3. Celeration = x1.4
During the first 12 months of SIBIS
use, the behaviors increased, multiplying
by a factor of
1.4 every six months.


*Each dot is the average data for 9 students. Chart
shows the 12 months before and 11 months after SIBIS was introduced.
Introduction dates differed among
students and occurred during the period 6/89 to 3/91
9 Students
Health
Dangerous